Stop Guessing: Use This Free eLearning Scope Calculator to Estimate Development Hours
How long does it really take to build an eLearning course? This free scope calculator uses four research-backed models to estimate eLearning development time based on your authoring tool, interaction types, and team profile.
By Nathan Stoker · Published Sep 13, 2026 · Updated Nov 8, 2026 · 7 min read
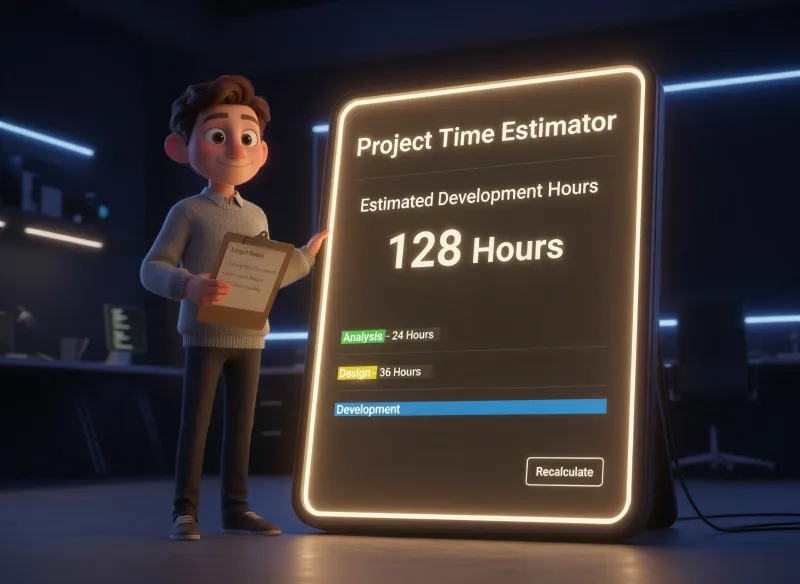
Every eLearning developer has heard the question: "Can you have this done by Friday?" Whether you are a solo instructional designer quoting a freelance project or an L&D manager defending your timeline to stakeholders, you need a defensible answer. The problem is that most estimation tools give you a single ratio and call it a day. Real projects have interactions, media assets, review cycles, accessibility requirements, and a dozen other factors that push that number up or down.
That is why I built the eLearning Scope Calculator, a free browser-based tool that combines four research-backed estimation models with granular project inputs to produce a realistic hour range for your next course build.
How long does it take to develop one hour of eLearning?
It depends on how interactive the course is. The numbers most people quote come from the Chapman Alliance's 2010 study of about 250 organizations:
Basic: 49 to 125 hours per finished hour
Interactive: 127 to 184 hours
Advanced: 217 to 716 hours
Other sources land close by. Tucker puts it around 133 hours, and the Department of Defense ranges run 75 to 200, 125 to 400 and 250 to 600 hours by level.
Your authoring tool changes the number too. In the calculator, Storyline is the baseline. Rise can come in about 25% faster at the low end, Captivate runs 10 to 25% slower, and custom HTML takes 55% to 110% longer.
Those ranges are wide on purpose. The calculator narrows them by counting your actual interactions, so a course with 20 multiple-choice questions and one GSAP animation gets a very different estimate from one with three game mechanics.
Why You Need More Than a Ratio
The most commonly cited benchmark in our industry comes from the Chapman Alliance study published in 2010. Chapman surveyed nearly 250 organizations and reported that one hour of interactive eLearning takes approximately 184 hours to develop. That number gets passed around in proposals and stakeholder meetings as if it were gospel.
The trouble is that 184:1 is an average across thousands of projects with wildly different scopes. A click-through compliance refresher and a branching cybersecurity simulation are not the same project, but a single ratio treats them that way. The same issue applies to every other published benchmark. As Robyn Defelice noted in the 2023 ATD update, development time varies considerably and organization-specific variables make standalone ratios unreliable for project planning.
The Scope Calculator addresses this by layering multiple adjustment factors on top of a base ratio. You select your estimation model, your authoring tool, your course structure, your interaction types, and your team profile. The tool then applies each factor to produce an optimistic, midpoint, and pessimistic estimate rather than a single number.
Four Estimation Models for eLearning Development Time
The calculator includes four distinct models. Each one reflects a different perspective on how long eLearning development takes, and each is useful in different contexts.
Chapman Alliance
This is the industry standard baseline. Chapman collected data from roughly 4,000 L&D professionals and broke eLearning into three tiers. Basic courses using static slides or simple authoring come in at 49 to 125 hours per finished hour. Interactive courses with drag-and-drop activities, branching, and moderate media land between 127 and 184 hours. Advanced courses involving full simulations and game mechanics range from 217 up to 716 hours per finished hour.
Chapman is the best model to use when you need a defensible number for a stakeholder who wants to see published research behind your estimate. It is also the most conservative starting point for interactive and game-based work because the upper ranges account for the full spectrum of organizational inefficiency the study captured.
Tucker Method
Christy Tucker is a veteran instructional designer who has tracked her own project hours for over a decade. Her approach starts with Chapman's phase percentages but adjusts them based on years of personal benchmarking and, more recently, AI-assisted workflows. Her practical ratio for a typical Level 2 course comes in around 133:1, notably lower than Chapman's 184:1.
The key difference is where the hours go. Tucker's data shows that authoring and programming consume roughly half of the total effort, with front-end analysis dropping to around 4 percent when you are working from existing content. She also accounts for real efficiencies from AI tools in storyboarding, image generation, and meeting notes.
Use Tucker when you are an experienced developer working solo or in a small team, especially if you have established templates and workflows. Her model rewards efficiency without being unrealistically optimistic.
DoD / Military
This model draws from U.S. Air Force Interactive Courseware estimates and the USMC Multimedia Development Guidelines. Military courseware development operates under a fundamentally different set of constraints. Section 508 compliance is mandatory from day one. Formal verification and validation cycles are built into every phase. Content may require classification reviews. Computer-managed instruction tracking has to meet specific DoD standards.
The ratios reflect this rigor. A basic knowledge course runs 75 to 200 hours per finished hour. Skill-based training with moderate simulation hits 125 to 400 hours. Attitude-based training at the highest simulation level can reach 250 to 600 hours per finished hour.
The phase distribution is also distinctive. The USMC guideline allocates 15 percent of total time to evaluation, nearly four times what Chapman suggests. Storyboarding and scripting take 19 percent, and authoring accounts for 28 percent.
Use the DoD model if you are building courseware for government contracts, regulated industries with formal review processes, or any environment where documentation and compliance requirements are as significant as the training content itself.
Custom Rates
The fourth option lets you enter your own optimistic and pessimistic hours-per-finished-minute ratios. This is designed for developers who have tracked their own data and know their personal benchmarks. You enter two numbers and the calculator applies all the same adjustment factors on top of your base.
Why Dev Environment Changes Everything
One of the most impactful selections in the calculator is the development environment. The tool you build in fundamentally shapes how long the project takes because each authoring platform handles interactions, media, and publishing differently.
Articulate Storyline
Storyline is the baseline in the calculator, with a 1.0 multiplier across the board. Its trigger-and-layer system is efficient for most standard interactions. You can build click-to-reveal, drag-and-drop, and branching scenarios without writing a single line of code. Where Storyline adds time is when you push beyond its native capabilities. Custom JavaScript variables, external library integrations, and GSAP animation components require hand-coding on top of the trigger system, and each one adds measurable development hours.
Articulate Rise 360
Rise is the fastest option for linear content, which is why the calculator applies a 0.75x multiplier on the low end. Pre-built blocks for accordions, tabs, labeled graphics, and process interactions mean you can assemble a clean course quickly. The trade-off is a hard ceiling on interactivity. Rise does not support branching scenarios, custom scoring logic, or complex state management natively. Code blocks extend what is possible but require building everything from scratch inside a constrained environment.
Adobe Captivate
Captivate earns a higher multiplier (1.1x to 1.25x) because general development takes longer than Storyline for comparable outputs. Where Captivate justifies the extra time is software simulations. The Show Me, Try Me, and Test Me workflow for recording and converting application walkthroughs is genuinely excellent and difficult to replicate in other tools. Responsive design in Captivate also adds notable complexity that other tools handle more transparently.
Custom HTML/CSS/JS
Building from scratch carries the highest multiplier in the calculator (1.55x to 2.1x) because there is no authoring tool doing the heavy lifting. Every interaction, every state transition, every responsive breakpoint is hand-coded. SCORM packaging is a separate effort on top of the build itself. The payoff is zero ceiling on what you can create. GSAP animations, React components, full browser APIs, WebGL, real-time data -- none of it is off limits. But every minute of that capability costs development hours.
How the eLearning Scope Calculator Works
The tool takes your base ratio from the selected model and applies a sequence of adjustments.
Course structure sets the foundation. A 20-minute linear Storyline course with the Chapman model starts at roughly 16 to 42 base hours. Switch to game-based and those numbers jump to 72 to 239 hours for the same seat time.
Screen count acts as a deviation from the baseline assumption of one screen per minute of seat time. Having 50 screens in a 20-minute course means more content density, which adds development time proportionally.
Interactions are the biggest variable after the base ratio. Each interaction type carries a base hour cost that scales with your dev environment. A simple multiple-choice question adds about 0.4 hours in Storyline. A custom GSAP component adds 7 hours. A full game mechanic with points, timers, and leaderboards adds 11 hours. These stack up quickly.
Media, process, and team factors layer on top. Custom graphics, video clips, VO production, storyboard depth, review rounds, accessibility standards, LMS integration, SME availability, team size, and experience level all push the estimate in predictable directions.
The result is a three-point estimate: optimistic, midpoint, and pessimistic. The midpoint uses a 55/45 pessimistic-to-optimistic weighting because, as anyone who has shipped a course knows, things tend to take longer than you hope.
Who This Is For
If you quote projects for clients, this tool gives you a research-backed starting point that you can adjust to your specific situation. If you manage an L&D team, it helps you set realistic expectations with stakeholders who think a 30-minute course should take a week. If you are new to instructional design, it teaches you which variables matter most and where time actually goes in a course build.
The calculator runs entirely in your browser. No login, no data collection, no server. Adjust any input and the estimate updates instantly. You can copy the full summary to paste into a proposal or project plan.
Scope calculator FAQ
How many hours does a one-hour Storyline course take?
For an interactive course, plan on roughly 127 to 184 hours of development per finished hour, based on the Chapman Alliance numbers. Use the calculator to tighten that for your project.
Is Rise faster than Storyline?
Usually, for block-based content. The calculator applies about a 25% saving at the low end for Rise.
Try the eLearning Scope Calculator
Nathan Stoker
I build custom eLearning in Storyline, Rise and JavaScript, and I make the free tools and templates on this site. Need an interaction like this in your course? Let's talk.